

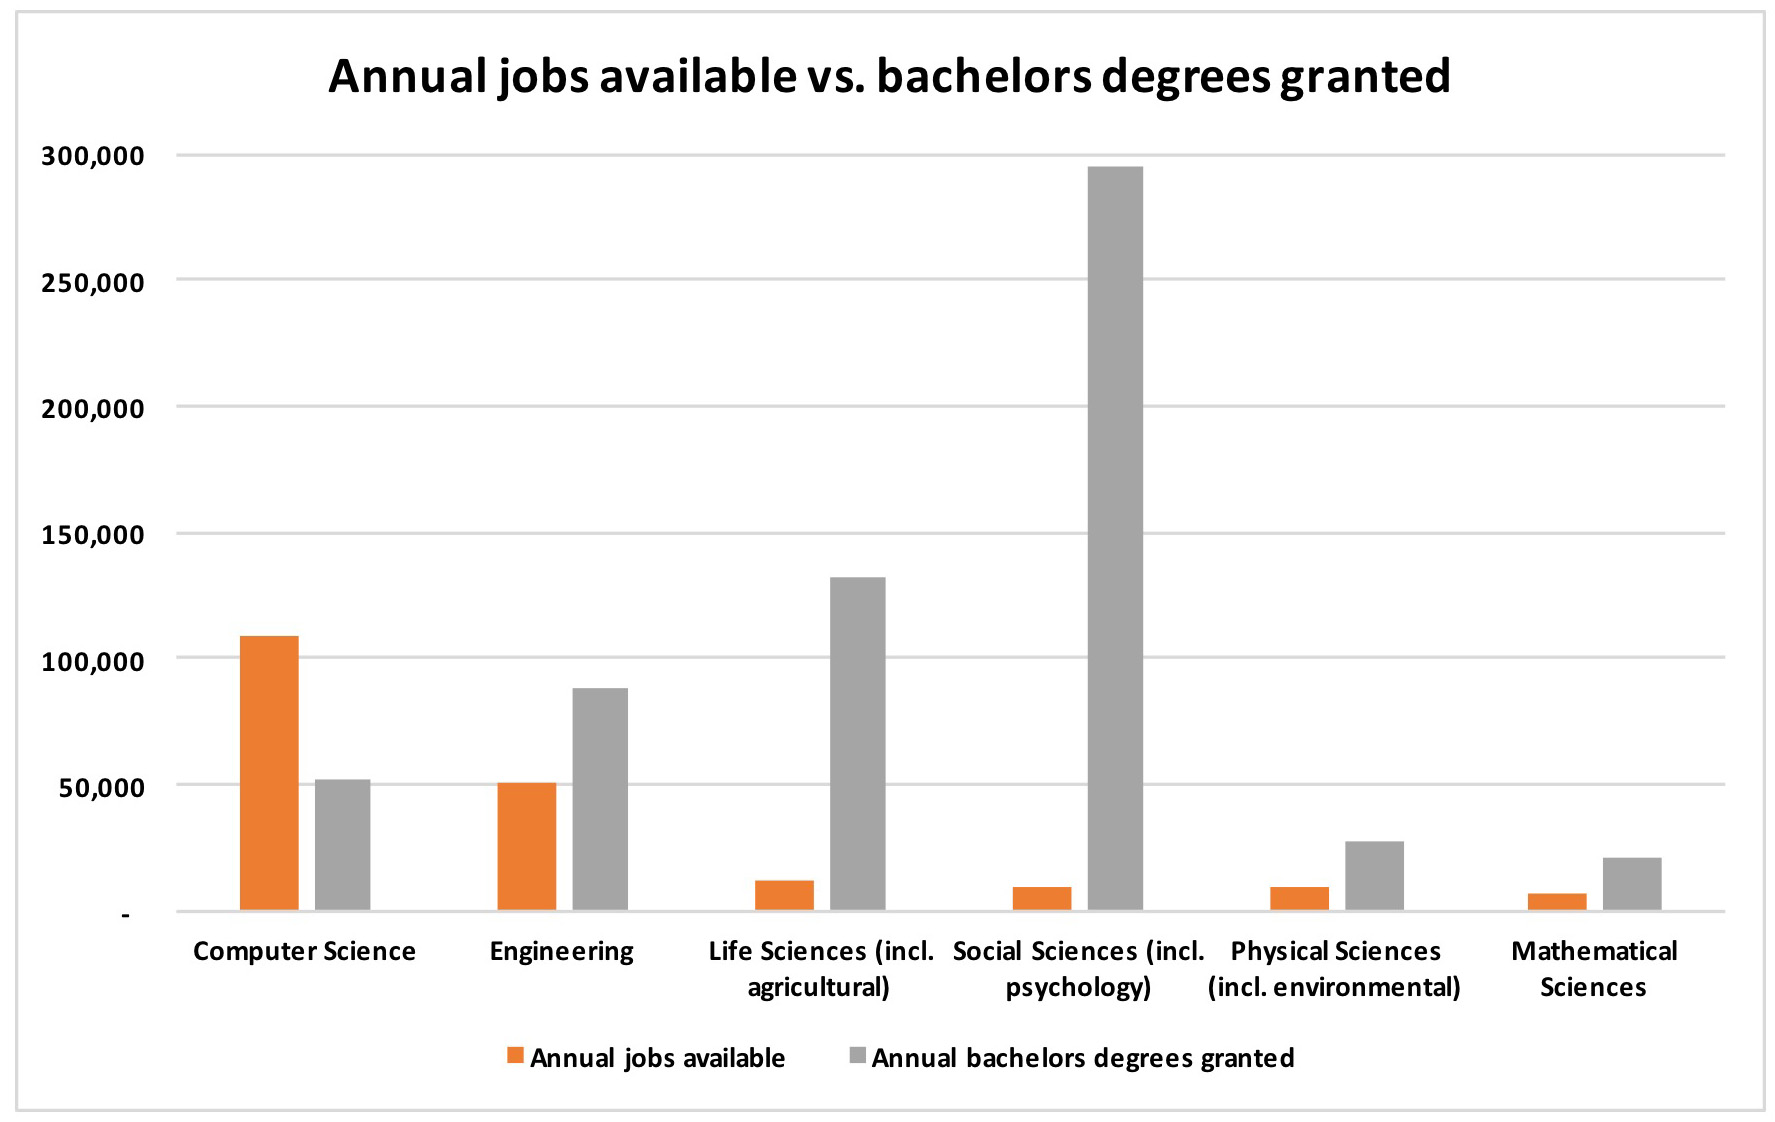
 The 2016 NSF Science & Engineering Indicators have recently been released, including data on the numbers of degrees granted in various fields of science and engineering.
Similarly, the 2016 US Bureau of Labor Statistics job projections have recently been released, covering the decade 2014-2024.
The Tale of the Tape: A chart of “annualized jobs available” (from BLS) vs. “annual degrees granted” (from NSF) for various fields.
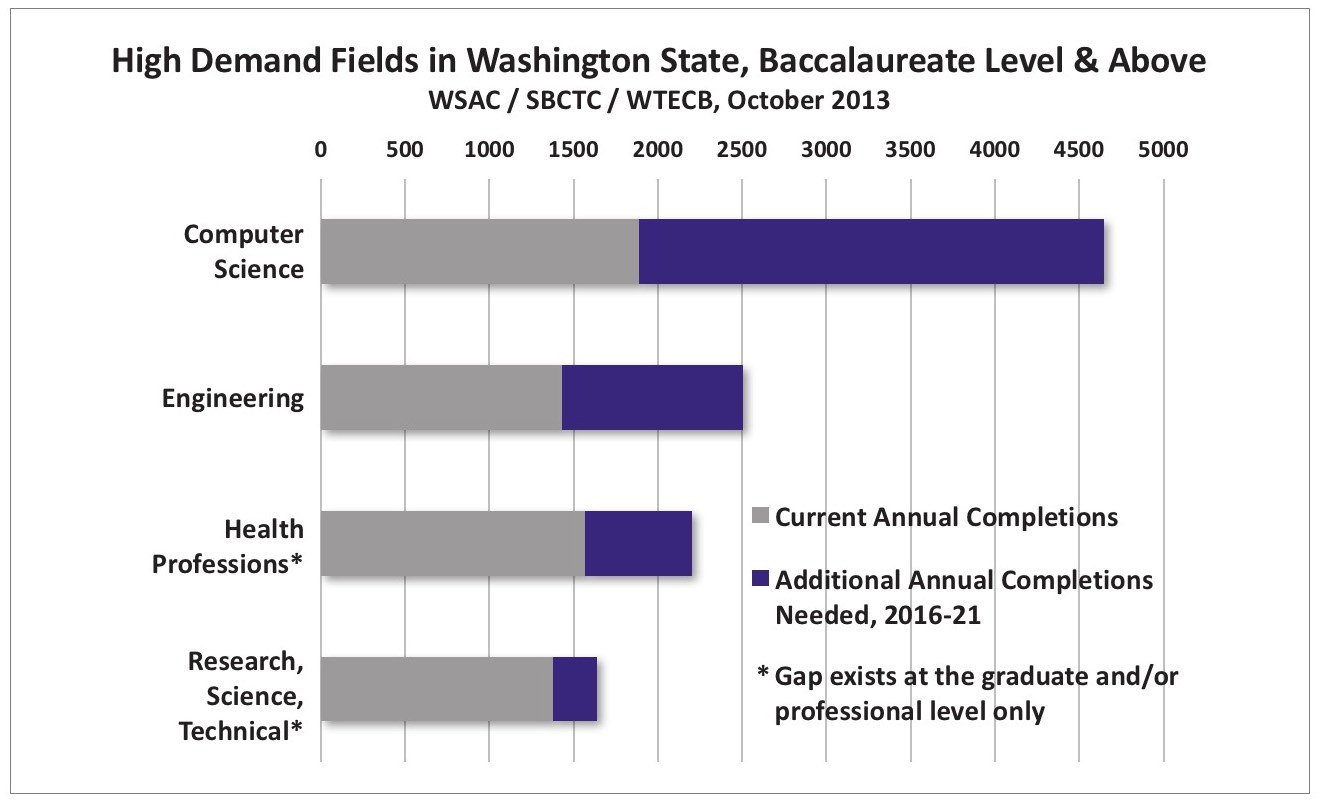 The story in Washington State is the same. Three state educational agencies looked across all fields (not just STEM fields) for those with any appreciable gap between “degrees granted” and “jobs available.” They found only four at the bachelors or graduate level. Computer science was #1, with a gap 2.5X as great as the second-place field – which was all fields of engineering added together (electrical, mechanical, civil, aeronautical, materials, etc.). (Of course, not all of those computer science jobs are in Washington’s vibrant software industry. For example, Washington’s aerospace industry employs roughly 3X as many computer scientists as aeronautical engineers!)
Wowsers!