


In the spring of 2020, schools and offices across the nation closed their doors en masse to in-person learning and working, restaurants and retail stores began extolling the virtues of curbside dining and delivery, and Zoom became a household name. In the midst of the global health emergency caused by the emergence of COVID-19, many of the services and activities people rely on as part of their daily lives — from doctors’ appointments to sessions at the gym — moved from the physical world to the digital one.
But not everyone made the transition evenly. In a paper recently published in Nature Communications, a team of University of Washington and Microsoft researchers presented the first population-scale study of how digital engagement shifted during the pandemic and how the shift to online resources may have differed across subpopulations. Using anonymized activity logs of online search activity, the researchers examined the types of information and assistance that people sought in the days of remote work, telehealth, and virtual education tied to a range of environmental and socioeconomic factors. Their findings offer new insights into the disparities in how people access critical resources against the backdrop of a public health emergency and economic upheaval.

“Prior research has shown that there are disparities in how people engage with digital resources, even when they have internet access. That ‘second-level digital divide’ has real-world implications for people’s health and well-being,” explained lead author Jina Suh, a Ph.D. student in the Allen School and principal researcher at Microsoft Research. “By steering so much of daily life online, the pandemic amplified or exacerbated those disparities and raised important questions about potential barriers to people obtaining essential information and support that they need.”
Suh and her co-authors — Allen School professor Tim Althoff and affiliate professors Eric Horvitz, chief scientific officer at Microsoft, and Ryen White, general manager at Microsoft Research — examined how that second-level digital divide changed during the pandemic by analyzing approximately 57 billion anonymized Bing search engine interactions across the U.S. between 2019 and 2020. Their analysis covered 25,150 ZIP codes representing 97% of the nation’s total population and leveraged the social determinants of health (SDoH), a framework from the U.S. Department of Health and Human Services setting out the conditions known to affect outcomes related to health and quality of life.
To gain a holistic view of how online behavior relates to offline needs, the researchers classified search interactions according to elements of SDoH, spanning health, education, economic assistance, and food access. For each of the identified elements, they compared the change in online search activity between two corresponding ZIP code groups for a set of census variables — race, population density, educational attainment, employment, health insurance and internet access — to capture how the subpopulations leveraged online resources differently during the pandemic. Their analysis followed a longitudinal before-after observational method with a matching-based approach to isolate the influences of different census variables on the observed changes. The team first calculated the percentage change in digital engagement for each search category from before and during the pandemic within each ZIP code group; next, they measured the percentage-point difference in those results to gauge the disparities between the two matched groups.
“Our methodology offers a level of detail and scale that can’t be achieved by conventional approaches to disparity research that rely on surveys or interviews,” Suh said. “It also allows us to account for normal seasonal variations and control for confounding factors in a way that traditional survey approaches cannot.”
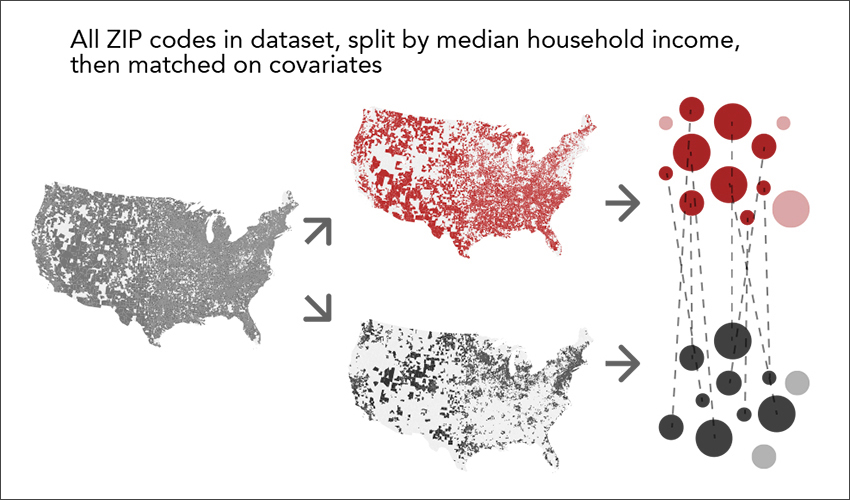
That control of confounding factors is important; since many of the socioeconomic and racial variables are correlated, it can be difficult to pinpoint which factors may be contributing to variances in digital engagement and design effective interventions. To sidestep potential confounding effects, Suh and her colleagues created matched pairings of ZIP codes for each census variable according to their similarity in other census variables. For example, to compare the magnitude of change on a particular SDoH element between ZIP codes above or below the $55,000 median household income, they matched a single high-income ZIP code to a single low-income ZIP code having a similar profile in the remaining variables. They repeated this step for all of the ZIP codes and each of the variables in turn, discarding any ZIP codes that could not be matched before performing their population-level analysis.
As anticipated, that analysis revealed some stark differences. Focusing on the aforementioned income variable, in the first four weeks after the pandemic was declared, the researchers found a significant gap — more than 200 percentage points — in the extent to which people ramped up their search for online health information between high-income ZIP codes versus low-income ZIP codes. Their analysis also revealed a difference of roughly 100 percentage points between ZIP codes with a higher than average proportion of Hispanic residents compared to those having a lower proportion of Hispanic residents. They saw smaller, but still measurable, disparities in ZIP codes with greater population density (a proxy for urban areas), higher rate of unemployment, and a higher proportion of Black residents compared to corresponding areas with lower density, lower unemployment, and a lower proportion of Black residents.
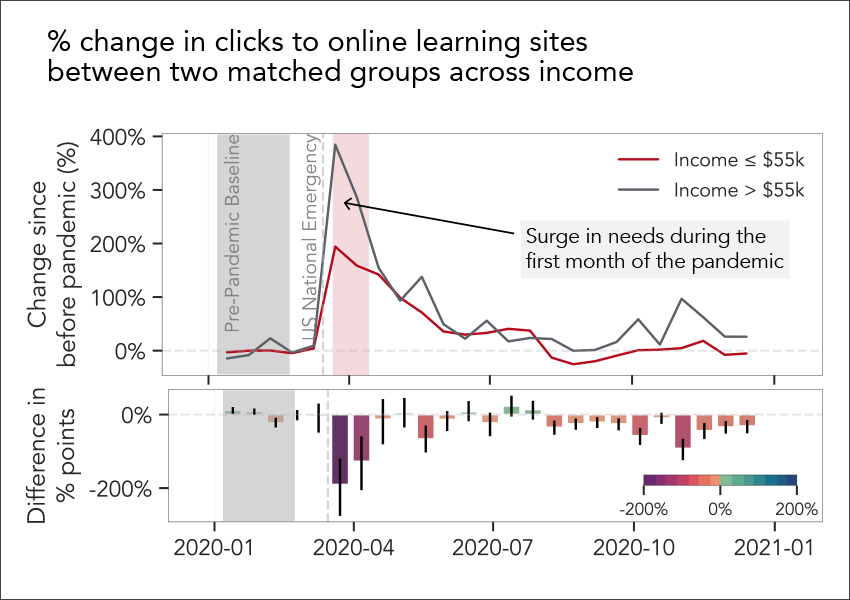
Another outgrowth of the pandemic was a rapid pivot to online learning. Here again, the researchers found that not everyone leveraged relevant digital resources to the same extent. In particular, while clicks to online learning sites in low-income ZIP codes increased by around 200% compared to pre-pandemic times, that figure was closer to 400% in high-income ZIP codes. Similar, though not necessarily as dramatic, differences were noted between ZIP codes with higher proportions of Black or Hispanic residents or greater population density and their counterparts during the same period — and that’s with controlling for internet access.
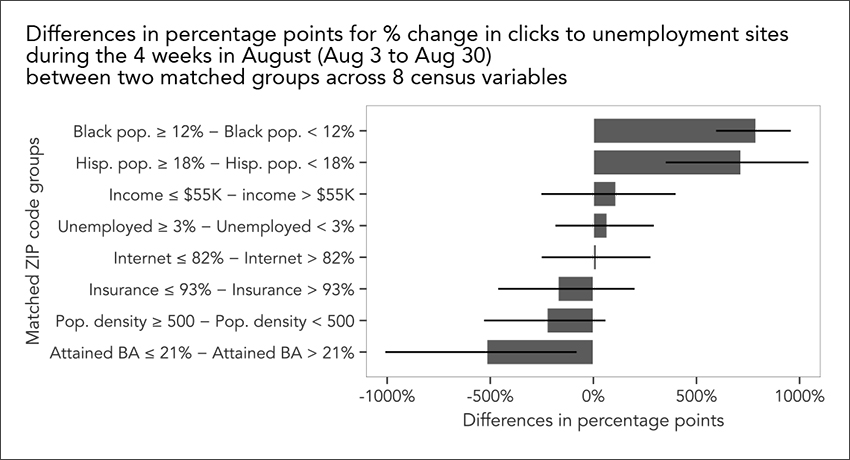
On the other hand, a greater uptick in online information-seeking was not necessarily a positive indicator of a community’s experience in weathering pandemic-induced impacts. In ZIP codes with higher proportions of Black residents, for instance, the spike in search queries for unemployment information in spring 2020 was nearly three times that found in ZIP codes having a below-average proportion of Black residents. That August, there was another surge, this time in clicks on unemployment websites, in ZIP codes with higher proportions of Black residents and Hispanic residents, respectively.
“The summer increase in unemployment site visits coincided with the expiration of federal supplemental unemployment insurance benefits. We saw an overall surge in interest online that was not reflected in the submitted claims data,” Suh noted. “The disparities we see online can help shine a light on economic disparities offline.”
As Suh and her co-authors point out in the paper, many of the disparities they see online can have downstream impacts on health and educational outcomes and economic opportunity — impacts that are likely to reverberate for individuals and communities long after stay-at-home orders and pandemic assistance programs have ended.
“We know that certain subpopulations have experienced a higher risk of COVID infection and mortality and a heavier socioeconomic burden as a result of the pandemic,” said Althoff. “Thanks to our ability to analyze billions of queries by millions of people, we have evidence of how some of those same subpopulations experienced the shift to digital resources differently, as well.
“There’s a saying, ‘you can’t manage what you can’t measure,’” he continued. “Our study illustrates the importance of measuring digital engagement aligned with indicators of health and well-being at the subpopulation level, and provides a blueprint for continuously monitoring changes in that engagement in real time. Only then will we manage to begin addressing the disparities and improve outcomes for people and society as a whole.”
Read the Nature Communications paper here and the related Microsoft Research Focus article here.