

In the days before single-cell RNA sequencing, researchers investigating the mechanisms and treatment of disease had to make do with running experiments on bulk cell profiles created by taking tissue samples and grinding them up, “sort of like putting them in a blender,” in the words of Allen School Ph.D. student Ethan Weinberger.
That milkshake may have brought all the biomedical scientists to the lab, but the bulk sequencing technique limited them to studying aggregations of populations of cells, with no way to distinguish among individual cell types. Nowadays, researchers can take measurements at the level of individual cells, enabling the exploration of such finer-grained distinctions and advancing our understanding of various biological functions. But without the right computational tools, even single-cell datasets can yield distinctions without a difference.
Weinberger is a member of the Allen School’s AIMS Lab, where he works with fellow Ph.D. student Chris Lin and professor Su-In Lee to leverage advances in artificial intelligence to help scientists get the most out of these increasingly robust datasets. In a paper published this week in Nature Methods, the team introduced ContrastiveVI, a deep learning framework for applying a powerful technique called contrastive analysis, or CA, to single-cell datasets to disentangle variations in the target, or treatment, cells from those shared between target and control cells when running experiments.
“Scientists want to investigate questions like ‘How does perturbing this particular gene affect its response to a pathogen?’ or ‘What happens when I hit a diseased cell with such-and-such a drug?’,“ explained Weinberger. “To do that, they need to be able to isolate the variations in the cell data caused by that perturbation or that drug from those that are shared with a control dataset. But existing models can’t separate those out, which might lead someone to draw erroneous conclusions from the data. ContrastiveVI solves that problem.”

CA has proven effective at this type of isolation in other contexts, but its utility in relation to single-cell datasets has so far been limited. That’s because existing computational models for analyzing single-cell data mostly rely on a single set of latent variables to model all variations in the data, effectively lumping them all together and precluding the ability to perform CA.
ContrastiveVI is the first deep learning model designed for performing CA on single-cell data. Unlike other approaches, the ContrastiveVI model explicitly separates latent variables into two categories, each with their own encoding function: shared variables, or those that are found in both the target and control cells, and salient variables, which are found exclusively among the target cells.
It is that second category that will excite scientists testing potential cancer drugs or analyzing the role of gene expression in the body’s response to disease.
“ContrastiveVI effectively distinguishes the factors that are salient — that is, relevant — to an experiment from confounding factors. This enables us to capture variations that are unique to the treated cells,” said Lee, senior author of the paper and holder of the Paul G. Allen Career Development Professorship in the Allen School. “ContrastiveVI will reveal tiny but important variations in the data that may be obscured by other models.”
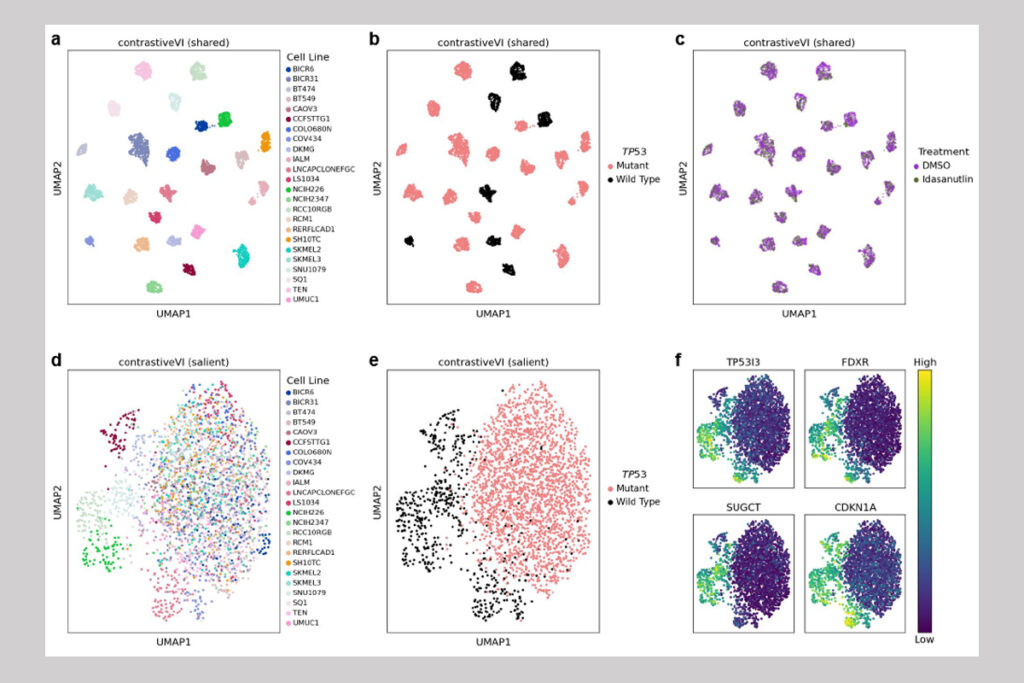
Lee and her co-authors validated ContrastiveVI using real-world datasets with previously verified results as their ground truth. In one experiment, the researchers applied ContrastiveVI to a target dataset of measurements taken from two dozen cancer cell lines treated with idasanutlin. This small-molecule compound has shown therapeutic potential owing to its activation of a tumor-suppressing protein in wild type — that is, unmutated — TP53 genes. The team used ContrastiveVI to analyze data on both wild type and mutated TP53 cell lines, which are non-responsive to idasanutlin, using a background dataset from the same cell lines treated with a different compound, dimethyl sulfoxide, as the control.
“A good result — one that agreed with prior knowledge — would show separation by cell line accompanied by increased mixing of treatment and control cells in the shared latent space, but mixing across mutant cell lines with clear separation based on mutation status in the salient latent space,” said Lin, co-lead author of the paper with Weinberger. “And that is exactly what we observed. In addition, our model indicated a separation between wild-type cell lines in the salient space that suggested a differential response to treatment, which spurred us to run additional analyses to identify the specific genes that contribute to those variations.”
Such findings, which could build upon prior knowledge and lead scientists to new hypotheses, is precisely the sort of progress Lin and his colleagues hope their model will support. In another demonstration of ContrastiveVI’s potential, the researchers applied the model to a dataset drawn from intestinal epithelial cells of mice displaying variations in gene expression due to infection with the bacteria Salmonella or the parasite H. polygyrus (H. poly), a type of roundworm, using healthy cells as the control. Once again, the model aligned with expectations by separating along cell type and mixing across infections in the shared latent space, while largely mixing across cell types and separating by pathogen in the salient latent space.
Like the cancer cell example, the pathogen infection experiment also yielded unexpected patterns that prompted the team to analyze further. These patterns included differences in the upregulation of multiple genes between H. poly–infected tuft cells and other infected cell types that may have been masked in prior experiments — and could point to a distinctive role in the body’s immune response.

The researchers also explored how the model could be adapted to isolate variations in multimodal single-cell datasets, such as a combination of RNA and surface protein expression data in CRISPR-perturbed cells. They layered their CA modeling techniques onto TotalVI, a deep generative model developed to analyze joint RNA-protein datasets, to create TotalContrastiveVI. In a series of experiments, they showed how their extended model could be used to identify clusters of cells in the salient latent space and apply downstream analysis to identify patterns that warranted further investigation.
TotalContrastiveVI may be a proof of concept, but the underlying model is no mere demonstration project. The team designed ContrastiveVI to make it easy for researchers to integrate the tool into existing workflows.
“Our software is essentially plug and play,” noted Lin. “Computational biologists can deploy ContrastiveVI right now in conjunction with standard tools in the field such as Scanpy to begin exploring single-cell datasets in greater detail than they could before.”
Those details could yield new hypotheses that could, in turn, lead to new biomedical breakthroughs.
“There are so many contexts in which scientists would want to do this,” said Weinberger. “People were already excited by the potential of single-cell datasets. With ContrastiveVI, they can unlock even more insights and expand our knowledge of the mechanisms and treatment of disease.
“To borrow a popular metaphor in biomedical circles: before, we had a smoothie; now we can zoom in on each part of the corresponding fruit salad.”